About
Bench-routes is a GUI-powered monitoring tool that monitors system services, application behaviour and performance of web applications and their routes (API). It performs a series of networking algorithms and calculations to find the real-time state of routes in an application.
Alerting is provided to the users based on application states, critical warnings and errors. Custom alerts occur when the delta (or change) in instantaneous responses fall beyond a threshold range.
Architecture
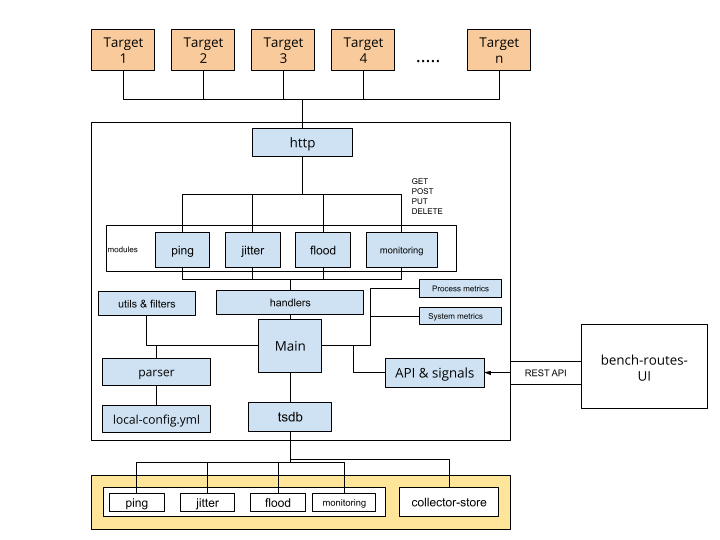
Collectors
The collector collects the metrics needed for a detailed view of an instance.
Overview
Bench-routes monitors itself (host), VM targets and collects the metrics externally. Information like ping, jitter, flood ping, req-res monitors is good to have since these define the overall state of the instance. However, information related to the internal conditions per process like the core usage by a process, memory, processes behaviour is important to monitor. Collector aims to collect internal metrics of instances, which can be accessed over HTTP, thus helping in carrying out advanced calculations.
Process collector
Process collector collects information per process and allows Bench-routes to monitor it. This enables monitoring of resources on a process level, leading to better observations. An example of this can be monitoring CPU, memory and network usage of a process with PID X (say chrome).
This is useful in situations of debugging an app, understanding the performance and behaviour of it over time, the load handling etc. These are crucial information that can also be used to predict the crash of a process/system, thus helping in saving precious resources and assets.
System collector
System metrics collect system-level information. Following are details that are captured:
- CPU usage
- RAM usage
- Memory cache
- Disk I/O
- Network speed (TODO)
- CPU clock rate (TODO)
- Total number of threads (TODO)
- Per-core performance (TODO)
Journal collector
Journal collector watches over the logs in systemd service. At present, this is used to categorize events in form of kernel or general events and show them in the UI. A future use of this can be to peek into these events by differentiating them between events that are logs, warns or error and allowing looking over them from an interface.